| EDUCATION
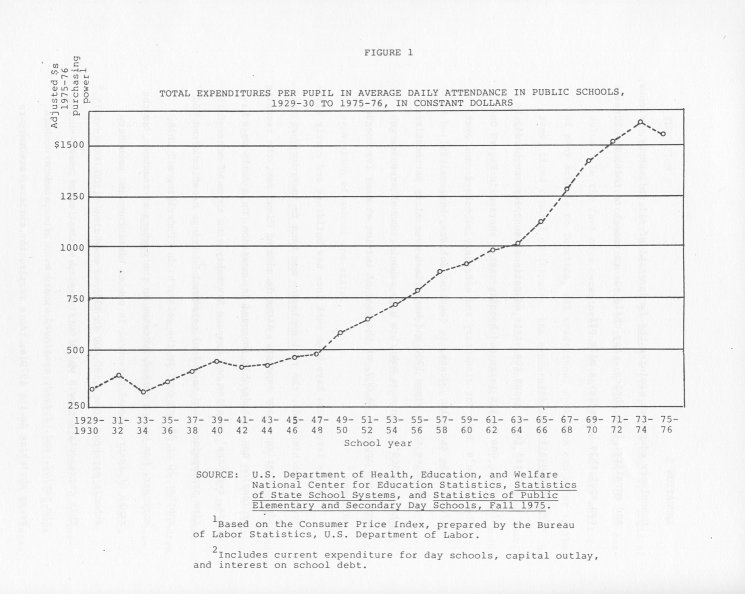
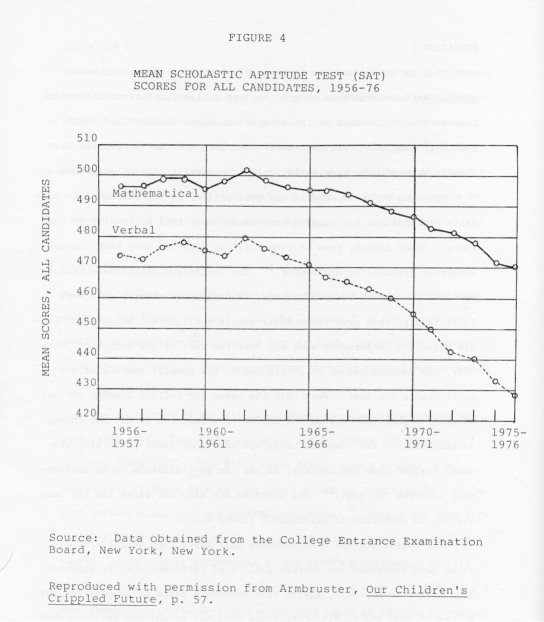
"Spirit-breaking is the principal function of typical lower-middle-class schools."--Paul Goodman, Compulsory Miseducation Conservative and Liberal education fashions have come and gone many times in the last century, but the background trend in the public school system is increasing expense (now $75 billion per year) and declining output (reflected in fourteen straight years of declines on the Scholastic Aptitude Test scores). Government-dictated education has stilled individualism and creativity, and its denial of free choice leads youngsters to feel Little moral responsibility for the values with which they have been indoctrinated.A bewildering array of cure-alls confronts those who seek to do something about education. Lower the student-teacher ratio. Go back to the "3 R's." Tailor-make programs to individual needs. Drill facts and figures. Instill concepts. Lower the compulsory schooling age. Raise it. They are all right. And all wrong. Like a pendulum American education has swung back and forth between liberal and conservative fashion. But these traditional ways of looking at schools fail to identify and explain the long-term trend: American education is costing more and producing less. Few notice that the system of state schools is pursuing a predictable course, a logic of its own, which causes the clock to run down with every swing of the pendulum. In the face of a deterioration which cripples the very ability of many schools to function, all traditional spokesmen can offer is the same, tired counsel of despair: the exhortations to "get involved," the plea for school boards, teachers, and parents to "care," the hope that, as Newsweek magazine recently opined, administrators "...will keep pushing, inch by painful inch."1 It is against this defeatism, against the needless sacrifice of millions of children and educators, against small-minded education dogmas that the Libertarian makes his forthright stand for educational freedom. The Libertarian demands free, independent education--a strict separation of school and state. The Fatal Flaw of Compulsory Education The undoing of public schools is the fact that they are public--run by government. In the present educational system we see all the problems familiar to any monopoly which people are forced, by law, to use. Education is not a standardized commodity; people have different needs for different kinds of it. Yet compulsory education laws force children and parents to consume the government's version of education-as-we-see-it whether it meets kids' needs or not. Values are the very essence and starting point of any worthwhile education; yet politically-determined school policies foist the lowest acceptable common denominator of values upon all. Or, worse, when influential political groups predominate schools, minorities are forced to disown their own heritage. Compulsory education violates the fundamental of all philosophy, science, and morality: free choice. Any child mature enough to think for himself can spot this hypocrisy a mile off. Public Education's Cost Several facts about the state educational
monopoly can hardly be disputed. One is its large and booming costs,
charted in Figure One.
|
|
Estimated expenditures per pupil in average daily attendance in
|
|
|
|
|||||||
|
other area |
|
|
Capital
outlay |
Interest
on school debt |
|||
| 1 | 2 | 3 | 4 | 5 | |||
| United States....
Alabama.............
Colorado............
Georgia.............
Iowa................
Maryland............
Missouri............
New Jersey..........
Ohio................
Outlying areas: American Samoa......
|
$1,581
1,199
1,769
1,235
1,684
1 828
1,335
2,076
1,413
(3)
|
$1,388
1,090
1,422
1,114
1,455
1,516
1,186
1,892
1,264
(3)
|
$145
102
290
75
200
266
118
125
119
(3)
|
$48
7
57
46
29
16
31
59
30
(3)
|
|||
| 1Includes current expenditures for day schools,
capital outlay, and interest on school debt.
2Includes expenditures for day schools only; excludes
adult
3Data not available. Source: Digest of Education Statistics, 1976, (Washington,
D.C.: HEW, National Center for Education Statistics, 1977), table 75.
|
|
Average annual salary of instructional staff in public elementary
and
|
|
| abased on the Consumer Price, Index, prepared
by the Bureau of Labor Statistics, U.S. Department of Labor.
bCalendar-year data from the U.S. Department of Commerce have been converted to a school-year basis by averaging the two appropriate calendar years in each case. cEstimated. Source: Digest of Educational Statistics,
1976, table 57
|
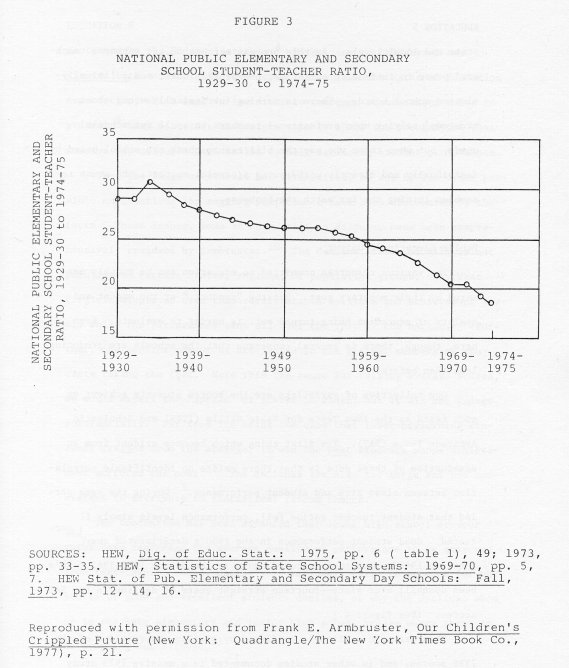
| teachers has fallen steadily since the 1930's and plummeted since
the 1950's. (See Figure 3.)
By no means does this indicate that classes are down to 18 or 19 children per teacher (though in some schools they are). What it does mean, for the most part, is that more teachers, full-time librarians, audiovisual specialists, and administrative personnel have been hired to teach the same or a somewhat expanded load of classes. More people teach less. While teachers are usually expected to work six hours a day, many average around four.5 Teachers claim, perhaps justifiably, that the task of educating children is tougher than ever, but it remains far from clear that the profession is responding by working longer hours (homework assignments, and thus correction, have been cut drastically over the last decade), or that the problems do not themselves result from educational policy (e.g., the need for remedial reading and mathematics instruction in junior high school). Public schools are showing signs of the bureaucracy and unresponsiveness which eventually debilitate all government enterprises. In larger cities, bureaucratization is already an impediment to effective education. According to New York City comptroller Harrison Goldin, nearly 60% of the city Board of Education's $2.9 billion education budget goes for administration; in some districts there are several more principals than schools and money has been lost because of organizational chaos.6 Simultaneously with increased numbers and higher pay, school personnel have fostered strong unions and consolidated their political strength by generous political contributions and activism at |
|
Average annual salary of instructional staff1 in full-time
|
|
|
| 1Includes supervisors, principals, classroom
teachers, and other instructional staff.
2Includes professional noninstructional administrative staff. 3Estimated. 4Salary data reported as median salary. 5Data not available. Source: Digest of Education Statistics, 1976, table 56. |
| state and local levels. As this process marches on, it enhances
teachers power to intimidate part-time, non-professional, and politically-elected
school boards. There is nothing intrinsically wrong about trustees'
relying upon professional teachers to spell out schools' needs, but when
those who pay the bill cannot check the school board by individually and
directly withdrawing financial support, the scene resembles letting the
fox watch the henhouse.
Public Education's Output The various resources committed to education
can be roughly measured by their monetary cost. But the "product," or the
amount and quality of education being turned out, is harder to evaluate.
Even here, though, there is general consensus that the-schools are producing
less than before.
|
| unusually stupid peer group of children moving through the educational
system. While the evidence about inherent ability garnered from IQ
tests is too sketchy to either confirm or deny this hypothesis, the pattern
of performance declines is not what we would expect were one generation
inherently inferior: i.e., poor showings in lower grades first, then in
higher grades. Instead, after about 1966 "declines occurred more or less
simultaneously in all the upper elementary and all high school grades of
any given state or district.14
Of the various other explanations concocted, the one receiving the most serious attention is the idea that social distractions (urban decay, Vietnam, Watergate) and weakened home environments (working mothers, television) make children less receptive to schooling. True as this thesis may be, placing great emphasis upon it bespeaks a lack of perspective. There were times before when social conditions of hunger and violence "distracted" kids much more forcefully than today, when parents enjoyed far less ability to assist with their children's education, when the cultural barriers of language and ethnicity were more formidable; still, children were somehow taught to read, write, and compute with a facility which might strain youthful counterparts today.15 We must look to the schools themselves to explain falling performance. Notwithstanding the notion that government education at least prepares students to function is society, it appears that the system's most serious failures are in communicating basic skills.16 Studies have shown that as many as one-third of all Americans lack the arithmetic and reading skills necessary to getting along competently in everyday life.17 Despite the fact that average years of schooling have increased, illiteracy levels, some experts claim, have hardly subsided in twenty years.18 A 1971 Harris survey showed that fifteen per cent of people over 16 years old were unable to read at the level needed for job applications, drivers' licenses, newspaper want ads, and care of one's health. Illiteracy remains almost twice as high among minority groups.19 This failure is unquestionably tragic. All the same, there is no universal agreement that it represents the whole cost of public educational policy--or that a return to the "3R's" is necessarily in order. Conservative hankerings for going back to the strictly disciplined, skills-oriented school system which apparently successfully taught millions of immigrant and farm kids how to cope with American life must confront sharp criticisms raised by Paul Goodman, John Holt, Joel Spring, and others.20 Ignorance of reading may not be such a bad thing, say these advocates of "progressive education," if the purpose of letters everywhere is confined to hawking shoddy wares and fastening the State's grip over the lives of gullible citizens. If an economy dominated by government and "feudal corporations" promises only dullard's work as the reward of years of educational sacrifice, then children are not necessarily irrational to drop out or to slip into a "reactive stupidity" as their only defense against compulsory boredom and indoctrination. Importantly, the state educational system everywhere fails to give kids a reason why they should want to learn--turning their natural curiosity and aliveness against the educational process and often knowledge in general. What cripples education? The school, said Goodman--"Because of the school's alien style, banning of spontaneous interest, extrinsic rewards and punishments...many of the backward readers might have had a better chance on the streets. An important tradeoff of costs and benefits exists between what we have somewhat loosely called "liberal" and "conservative" educational ideas. And it is doubtful that this is the only such tradeoff. The lesson is clear: no single educational philosophy is imposed upon a mass group of children without causing much pain, complaint, and tragic under-performance. Does there need to be one education for everyone? No. Stated this plainly, the proposition sounds ridiculous on its face. Education can achieve as many different values as individuals hold. The demands that people should learn uniformly--demands that have been heard in public education from the start--are unwarranted impositions upon the liberty of each to seek his or her own fulfillment in his or her own way. Even if the knowledge people seek tends to be largely similar, the natural diversity of children should lead us to offer as wide a range of educational methods as we can afford. Both liberal and conservative commentators have, in their own way, recognized that students' individual uniqueness calls for educational diversity. Goodman and others lamented the shortchanging in public schools of the bright child, the one who could grasp concepts easily and tackled all subjects with grace. But Armbruster has pointed out, too, that when "progressive education" is in vogue it is the children with lower IQ's and superior memorizing ability who are made "second-class citizens."22 In both camps one hears proposed a "two-track" system wherein students could be shifted from memorization to the conceptual approach according to their abilities, and where all, it is contended, would at least learn something.23 But "something" is still less than we should accept. Who is to say that the memorization and "concepts" tradeoff is the only, or even the most important, issue in educational practice? It has taken generations for government educators to discover that neither liberal or conservative educational methods are a cure-all (and they've forgotten the lessons almost as rapidly as they were learned). What other more subtle questions remain undiscovered and untreated because the schools are incapable of experiment and independence? Diversity has never been the strong suit of government. The education of countless children will suffer and the efforts of many dedicated teachers will be needlessly wasted if we blindly insist that the proper mix" of educational alternatives be attempted within the context of the government educational monopoly. Education which truly meets the needs of the public can only be achieved by allowing the public free choice to sample, judge, and individually "vote" for the education they choose. Because State control over education restricts free choice, policy experiments tend to be made after the manner of mass stampedes. Whole generations become guinea pigs for the "new" this or the "new" that; then, when educators and parents recoil from the failure of each fad to educate children to whom it never should have been applied, the pendulum swings back. Thus, one product of the recent wave of progressivism is a backlash in which 83% of Americans favor getting back to reading, writing, and arithmetic, while rating "lack of discipline" as the top complaint against public schools.24 Opinion polls throughout the 1970's have illustrated a growing demand by parents for measurable educational results.25 The practice of scurrying from one vain hope to another is demonstrably hopeless, and if this is all the system can do, it is bankrupt. The public schools, reflecting political sentiment as it is expressed by the majority for the day, can only try one thing at a time. The children, and no less the taxpayers, need free, independent schools. The idea of free schools would strike us as more familiar were we to recapture our sense of history. (One function of the State educational monopoly has been to drop much inconvenient history down the memory hole.) Public education in both England and America was built upon a system of practically universal teaching established by private, voluntary efforts. While compulsory education laws date back to early Puritan settlements, they did not become quickly accepted outside New England. Prominent early Americans championed mass learning, but most probably shared the view of Thomas Jefferson, who said, It is better to tolerate the rare instance of a parent refusing to let his child be educated than to shock the common feelings and ideas by forcible transportation and education of the infant against the will of the father.26Consequently, nineteenth-century education was often provided by churches or other voluntary cooperation. Far from being reserved for the rich, it prepared millions for the greatest expansion of productivity and wealth the Western world had ever seen, and private schools operating on the Lancaster system of student monitors were able to educate so inexpensively that they could afford to open their doors to the poorest students free. Compulsory education and public schools first took root in New England, but not until almost 1900 did all states compel attendance.27 The coercion-bent "public educationists" did remarkably little creating, but much taking over. Their arguments were explicitly couched in terms offensive to Libertarian principles: The regular attendance at the school shall be an object of special control and the most active vigilance; for this is the source from which flow all the advantages the school can produce. It would be very fortunate if parents and children were always willing of themselves...Although it is lamentable to be forced to use constraint, it is almost always necessary to commence with it.28And this, It is national, rational, republican education; free for all at the expense of all, conducted under the guardianship of the state, and for the honour, the happiness, the virtue, and the salvation of the state.29The world has certainly changed since 1850. There is more to be taught, new social demands which individuals must meet in order to achieve what is commonly described as "success." But is education fundamentally different? The nature of inquiry remains the same. The nature of private and public institutions has changed not a whit. And some free schools, those which have escaped being strangled and co-opted by the spiders-web of state accreditation regulations, do quite well.30 As the nation enters a period of declining enrollments, and ever fewer taxpayers receive any direct benefit from the public school system, we face a unique political opportunity to scale back and eliminate the public schools-allowing free schools to flourish as they should. Regrettably, government's usurpation of education has become so extensive that our positive case for voluntary, free schools must remain largely prospective--resting on the validity of Libertarian arguments rather than concrete examples. We can barely surmise what education options await us on the free market. This does not mean that the benefits of such educational liberty are uncertain or negligible; the rampant dissatisfaction with education today should indicate how much we all sacrifice to the State educational monopoly. Libertarian Proposals Because government takeover has proceeded
so far, no halfway measures can suffice to repair education. To the
question of "What will Libertarians do about education?" we must reply
with a simple program:
|
|
PROJECTED PUBLIC AND PRIVATE ELEMENTARY AND SECONDARY SCHOOL ENROLLMENTS.........1978-1983 (Thousands) |
|
all grades |
K-8 |
9-12 |
|||||||||||||||||
|
|
|
|
Source: Tax Foundation, Inc., Facts and Figures
on Government Finance, p. 255
|
PUBLIC ELEMENTARY AND SECONDARY SCHOOL REVENUE BY GOVERNMENT SOURCE OF FUNDS (Selected Years) |
|
|
|
|||||||||||||||||||
|
|
|
Source: Tax Foundation, Inc., Facts and Figures on Government
Finance (New York, Tax Foundation, Inc., 1975), p. 257
|
ESTIMATED ENROLLMENT IN NONPUBLIC ELEMENTARY AND SECONDARY SCHOOLS, BY STATE FALL 1976 |
|
|
| Source: Digest of Education Statistics, 1976, Table 46. |
| EDUCATION NOTES |
| 1. | "City Schools in Crisis," Newsweek, September 12, 1977, p. 70. |
| 2. | Frank E. Armbruster, Our Childrens's Crippled Future (New York: Quadrangle/The New York Times Book Co., 1977) p. 18. |
| 3. | Ibid., p. 22. |
| 4. | Ibid., p. 19 |
| 5. | Ibid., p. 22. |
| 6. | "City Schools in Crisis," Newsweek, pp. 63-64. |
| 7. | Armbruster, pp. 117-118. |
| 8. | This report, issued July 14, 1975 under the title The U.S. Primary and Secondary Education Process, serves as the basis for the publication, Our Children's Crippled Future. |
| 9. | "Teacher's Group: Testing at Fault in SAT Score Drop," The Washington Post, August 19, 1977. |
| 10. | See Armbruster, Chapter 4. Cf. "Why SAT Scores Decline," Newsweek, September 5, 1977, pp. 82-83, concerning a recent College Entrance Examination Board report (issued under the chairmanship of Willard Wirtz) which researched this question. |
| 11. | Armbruster, p. 183. |
| 12. | Ibid., p. 58. |
| 13. | Ibid., p. 65. |
| 14. | Ibid., p. 44. |
| 15. | This point is well discussed in Armbruster, chapter 8. The Wirtz Commission report, unfortunately, perpetuates this dogma without quite justifying it. |
| 16. | If it is political, democratic skills which concern us, then the failure is more serious yet, as Americans have remained stolidly ignorant of both political and economic systems. |
| 17. | John E. Bailey III, "Here Comes Voluntary Education," Reason (January 1977), p. 18. |
| 18. | This is the claim of Wallace Roberts, "Right to Read: Lost in PR," Washington Monthly, (September 1973), P. 35. Cited in Armbruster, p. 62. |
| 19. | Armbruster, p. 61. The Navy is also discovering, much to its chagrin, that it has had to simplify manuals and establish remedial reading courses. Seventy per cent of the 12,000 recruits who flunked boot camp in 1976 could not read The Blue Jacket's Manual, despite the high percentage of high school diplomas among the group. See "Navy Blues," Newsweek, September 5, 1977, p. 83. |
| 20. | See Paul Goodman, Compulsory Miseducation and the Community of Scholars (New York: Vintage Books, 1964); John Holt, Instead of Education: Ways to Help People Do Things Better (New York: Delta Publishing, 1977); and Joel Spring, A Primer of Libertarian Education (New York: Free Life Editions, 1975). |
| 21. | Goodman, Compulsory Miseducation, p. 26. |
| 22. | Armbruster, p. 102. |
| 23. | Ibid., p. 210. |
| 24. | "Return the Rod," Newsweek, September 5, 1977, p. 83. |
| 25. | To a large extent this attitude has hardly ever faded. See Armbruster, chapter 8, for a discussion of parental attitudes toward education. |
| 26. | Saul K. Padover, Jefferson (New York: Harcourt, Brace, 1942), p. 169. This quotation is cited in Murray N. Rothbard, Education, Free and Compulsory (Wichita, KS: Center for Independent Education, n.d.), p. 42. |
| 27. | Rothbard, Education, Free and Compulsory, p. 41. |
| 28. | Henry Barnard, quoted in Rothbard, Education, Free and Compulsory, P. 51. |
| 29. | Robert Dale Owen and Frances Wright, Tracts on Republican Government and National Education (London, 1847), cited in Rothbard, Education, Free and Compulsory, p. 46. |
| 30. | See, for instance, the story of the Wichita Collegiate School in Robert Love, How to Start Your Own School (Ottawa, IL: Green Hill Publishers, 1973). See also Anne Husted Burleigh, ed., Education In a Free Society (Indianapolis, IN: Liberty Fund, 1973). |
| Chapter 1 |
|